Archive for the 'Rasters' Category

AutoCAD Map3D 2011 and Raster Design OE

Anyone that uses MrSID image files in their Map3D or Civil 3D know that you  need to install the Raster Design Object Enabler or Raster Design installed to insert them with the Map image insert command. Problem is right now there is no Raster Design OE for the 2011 versions. However thanks to a geeky customer there is a work around.

The first step is you need a working version of an AutoCAD 2010 installed on your workstation. This can be Map3D, Civil 3D, Standard AutoCAD of the vanilla favor or even the water down application named TrueView. Now if you are running on a 64bit OS I was told you can skip the 2010 products but with a 32 bit OS you need one of those install.

Next download and install the 2010 version of the Raster Design OE. Located here http://usa.autodesk.com/getdoc/id=DL13023431. A reminder you need administrator rights to install it and follow the standards to install any of AutoCAD applications, in other words shut down any apps you have running and shut down you anti-virus software for the installs.

The next step is you need to open the windows registry. To do this the simple way is from the START button > Run and type in regedit for the “open”  then click the OK button. Now a disclaimer, if you don’t feel comfortable working with the registry then call some that does. Do not blame the Murph if your PC starts to act up later because you messed up the registry.

With the registry open navigate/browse to the

“HKEY_LOCAL_MACHINE\SOFTWARE\Autodesk\AutoCAD\R18.0\AdImaging” 

key. Select it, right click, and select Export. Save the exported registry key to a folder that you can get to, the name for it can be any name of your choice (provide you follow the naming convections enforced by Microsoft).

export_key

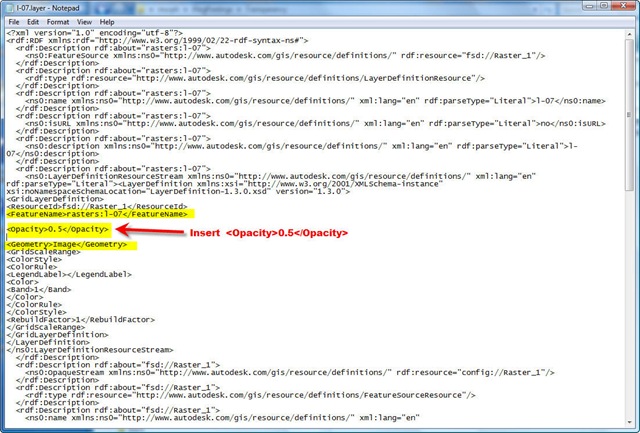
Now browse to the folder you saved the exported key to and open it in a text editor (Notepad works best). With the file open edit the first line (not the top header line) so it reads as 

[HKEY_LOCAL_MACHINE\SOFTWARE\Autodesk\AutoCAD\R18.1\AdImaging]

Just change the R18.0 to read R18.1. Save the file and close it.

regedit

Next step is to double click on the file in Windows Explorer. This will import the registry key into the registry.  If you get the Warning Message / Registry Editor

warning

just click the OK button.

Now if everything worked you should be able to open up Map3D or Civil 3D 2011 and use the Mapiinsert to insert a MrSID format image into you projects like you could before.

NOW A BIGGER DISCLAIMER(s):

First this is a hack to get the SID files in the 2011 versions, it is not supported by Autodesk so if something goes wrong don’t expect help from your support team. Second anyone that knows what all those numbers mean in the registry will see that the imported registry key is for the 2011 version but still points to 2010 Raster Design OE, if you try to install the supported version of Raster Design OE when it gets released you may get the message saying it is already installed. You may have to delete that key for the official supported version to install and work properly .

Raster, Raster, Who has a Raster

From time to time I see users asking what is the best method to insert a raster file into Map3D or Civil 3D. There are a 4 known methods to insert a raster file into a drawing. First the standard AutoCAD insert, then there is the Map image insert command, and now with FDO there is the data connect method. Last we can use the Object Link and Embedding (OLE) method.  So what method do I suggest? My standard reply is what format and type is the raster and what do you want to do with the raster afterwards?

First lets review on what a raster file is and how they advanced over the years. A raster file contains cells or grids called pixels. The number of pixels is determined by the resolution of the raster.   A simple 300 x 300 resolution raster has 300 pixels on the X axis or horizontal and 300 on the Y axis or vertical for a total of 90,000 pixels. Each pixel has values or attributes assigned to it. One of the attribute is the location or pixel number in the file. It may be as simple as 1,1 for column 1 row 1, or 1 for the first location in the file.  Another attribute is the display value for that pixel. In the beginning the value was either 1 or 0 for on or off.  This is know as a bi-tonal raster. As technology progressed so did the values and attributes of the pixels, where today we have a color attribute and even elevation attributes along with a host of other attributes assigned to a pixel.  Just like vector objects in a dwg have attributes known as object properties like Layer, Color and custom properties such as object data, pixels have data attached to them.

Wow lets back up, did I say elevation, as in 3D? Yes I did. The technology has advance from the old DOS bmp days to create 3D raster. ESRI has been doing it for a few years now with their 3D analysis add-on for the ArcGIS programs. Some DEM files are nothing more that raster files with an elevation assigned to pixels. Same for the newer TIFF and Jpeg formats. Now when we throw multi-spectral images, know as remote sensing into this pot we not only have another a different ballgame but also a whole different ball field to play on. Multi-spectral images are made up of multiple files with each file being from a different spectrum of the light range.

The kicker to all this is not only can the pixels in a raster contain various attributes but the file extensions can all be the same. A TIFF is a TIFF. Example,  a picture we take with our Kodak Easy Share camera can have the same file extension as a image taken from a satellite orbiting the earth miles away. It is not until we open the image or raster file in the application or software that the attributes are exposed, then only part of them depending on the application used to open the file.

Using Windows Photo Galley works good to edit those family pictures from the Kodak to remove red eye, adjust the colors and print a 8 x10  photograph, but using the same application to work with a raster file that contains an elevation attributes to display as 3D will not work. It also works the other way around. Using a high end application designed for working with multi-spectral images to crop and print the Kodak Easy Share file is not only over kill but the results may not be what you expect and performance will suffer with the program stumbling over the simple attributes. To use a metaphor example of this lets say we have an acre of grass to mow with our little Briggs & Stratton powered mover. We know that if we use a high octane gasoline in an internal combustion engine the performance is increased. However if we use gasoline with 106 octane in the mower we may not get a very well cut yard. Either the engine is running too fast to get a good even cut of the grass or by the time we get half way done the engine locks up and we end up with the job half way complete. We need to use the right tool with the right material to complete the job successfully. 

So if you are still reading here are my suggestions on how to add that raster file to you drawing/map.

OLE – Only use it if you working in AutoCAD LT
AutoCAD Insert – For adding your company logo to a title block or to add simple images (including renderings) as a detail to your project, where placement and scale may not be of importance.
AutoCAD Map3D Image Insert – Simple aerial images that are geo-referenced and you need them to align with your line work.
AutoCAD Map Data Connect (FDO) – Raster files that contain elevations, Multi-spectral images or high end aerials images.

Now how do you tell if the raster file is a simple aerial or a high end aerial? Most likely if you downloaded it from the Internet and it’s over 3 years old it is a good chance it’s a simple aerial unless you get the meta-data with it and it states otherwise.

Transparency of Images

If you tried to set an image transparent with the normal transparent tools you found out it only works with one color. If fact all it does is turn off that color you select and is not really making anything transparent. Transparent as defined by Merriam-Webster is “fine or sheer enough to be seen through”. There is no see though when you just turn off a color. Using the data connect with FDO we can make polygon features transparent should we be able to do the same for images? Well we can with a little trick.

First we need to use the data connect to add the image to our map. Then save the image layer to “LAYER” file. When you save the layer it creates a file with an extension of layer,  If you are not aware of what a layer file is, it’s an xml file that contains information on the data file as to how it is connected to the map, the data it contains (spatial & data),  and how it is displayed or theme. Once you saved the image file to a Layer remove that image layer from the display manager and disconnect from the file(s) in the data connect palette.

Now browse to the image.layer file you created and open it in “Notepad”. Scroll down until you see the tags;

 “<FeatureName>rasters:Name</FeatureName>”  “<Geometry>Image</Geometry> “

Now insert between the two tags

<Opacity>0.5</Opacity>

layer_edit

Save the file after you edited it. The number 0.5 is the amount of transparency with the larger the number the more transparent the image will be. 0.9 is almost translucent and 0.1 is of little transparency. Now use the Load Layer tool from the Data Icon in the Display Manager to add the image to the map.

So why would anyone need an image to be transparent to start with when we can place it at the bottom of the draw order and make all the other layers transparent?  First off, how often have you reopened the map to find out the draw order was not as you had it set when you closed the map drawing? Another reason you may want to set an image to be transparent would be if you have overlapping images in the map. Maybe you have an current aerial image and an aerial of the same are that is 10 yeas ago and you need to do a time lapse study of the area. Toggling the images on and off can get frustrating after a while, where as having one transparent will allow you to see though it to do the analysis a lot easier.

Here are a few before and after screen captures of the results.

Normal 

How we normally do it with the image layer at the bottom of the display draw order and the polygon with transparency.

image_Transparency

Here is with the image with transparency at 0.5 and the image layer at the top of the display draw order.

closer_look

A closer look of the above. Notice how the street centerlines show though the image file.

If you look close enough you will see a grid pattern in the image after we make it transparent, I only guess that is the way Map3D renders the image but after a test print of the map the grid is not getting plotted so I see no harm in it being there. Also do not forget about the MAPPLOTTRANSPARENCY command if you want to plot with transparency.


Archives

Readers Locations

Top Rated posts

Chat room