Archive for the 'Extras' Category

Marketing with Map3D plus

As most of my readers know I was working with an Autodesk reseller as their Geospatial technician. One of the duties was visiting a customer at their office either to offer support, demo some new feature or provide some other service. Now with me being based out of my home at the farthest  northern area of the reseller’s area  I might need to drive 8 hours or more to get to some of those customers. I didn’t make much senses (or dollars) to drive that distance for a 2 hour meeting then drive back. So most of the time I would get my sale reps in those areas to set up visits with other customers in the area to make the best use of my time. Not the trouble was finding the customers in the area that may be Geospatial or Map users. Unlike some of the other AutoCAD vertical applications Map3D users are not major customers or may only have 1-3 licenses of AutoCAD MAP3D. They tend to slip though the cracks a lot of time if they don’t call the reseller every so often. Now I need to say kudos to the sale reps that I worked with, they did the best they could to find those customers.

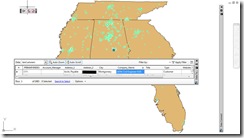
So how can we make it better or easier to locate those customer? Simple use the product we sold and demo. Anyone that is in the sales business rather its software or widgets and doodads to services and consulting has a record of their customers and what products those customers buy and use. Either in some database/spreadsheet or even on some paper bound books in the back room. The first step and the hardest is plotting those customers on a map. With some geocoding features I had I was able to to create the customers locations as points on an AutoCAD MAP3D dwg. So now I could open up that map select the customer I was going to visit in the table view then create a buffer to select other customers in the area.

mapSelect

The trouble was knowing if that customer was a Geospatial customer or not. Solving that means having the database contain the products the customer used include then querying on that as well. The next big huddle was I can do it in AutoCAD MAP3D with no problem but the folks that schedule the visits may not be able to. Either they don’t have MAP3D and the data on their laptops or they don’t have the knowledge to do the query. So the next step is to the web. With a Open Source Map Guide installment and access to the it for the sales folks it was just a simple publish my map and data to that Map Guide server. With a few sample code or examples it was easy to create a couple search buttons to locate the first customer then create the buffer & query then return a list of the other customers in the area. Now the only trouble was the Map Guide server was an old PC I had in my home. That meant to really use it required me to open up my firewall to the general public and my ISP to keep the line up at all time.  As it was, the time to load a MG page was way to long and not feasible let alone the time to query the map for the data. In a nutshell that would of been great if the server was a real web server and on the employers network. Sorry I don’t have any screen capture of the Map Guide server running this, the PC that hosted it started smoking one day and smelled a little funny so it sits out in the garage right now. 

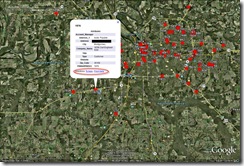
The next idea was Google Earth and Google Maps. Using the free Google Earth provider from SL-KING I was able to create  a kmz file that could be  opened in Google Earth. Now all I needed to do was provide that kmz to the sales team and instruction on using it.

GE

An extra benefit to the Google earth was it could provide driving instructions to the customers sites as well.

So you may now be saying “That’s great Murph, you can now visit more than one customer on your trips but the title of the post is MARKETING with Map3D”.

Right so where does the marketing come into this? Well step one was getting the customers on the map. Step two is having as much data on those customers as you can get. Having the product they use, having the type of work they do, the number of users and so on in the data. Once that data is there it can be used to “SEE” where the marketing needs to go, where the best location to rope in new customer is at. It’s easier to sell a boat to someone that lives next to water that it is to a nomad. Adding more data and layers  can make the queries even better. Having data on event centers or hotels or places to hold those conferences may give marketing a better chance to select the where at next time or to keep the cost down and the ROI up.

Now my disclaimer on this is I never had the chance to implement this as well as it should be for a number of reasons and I’m only posting this after seeing an job opening for a Marking Analysis  this morning and it brought back memories of doing it. So any marketing folks reading this you can add another tool to your toolbox.
Subscription Advantage Packs

If you are a subscription member there a new extension you can download. The subscription extensions now called Subscription Advantage Packs (SAP) are available on the subscription site.  The SAP for AutoCAD Map3D 2010 contains tools to use LIDAR or point clouds data. If anyone ever wanted to use large LIDAR files or point clouds you now can with the SAP. So what can you do with this data? Well depending on the data a lot.  First here is how you can start using it.

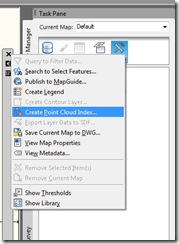
First on the Display Manager, click on the Tools Icon, select Create Point Cloud Index. The “Index” needs to be created for all new LiDAR (las) files.

 CreateIndex

When you select to create the point cloud index the Point Cloud Manager palette opens. Here is where you browse to the LiDAR files and add them to a list or you can even group multiple files together.

PointCloud Manager

Once the files are listed in the Point Group Manager highlight the file or group and click on the Generate Index. This creates a file with an ISD extension. You have the option prior to generating the index as to the file location and name by selecting in the output column and browsing to a folder and renaming the file. The default is the same folder and file name as the las file. Generating the index takes a few minutes depending on the file size and number of points in the file. A process indicator is displayed in the the  Point Cloud Manager as it is generated.  Once the index is created you can click the Add to Map button to add the point cloud to your map.  Note you only need to create the index for the las file once, you can use the isd file to load the point cloud in any drawing. Once you created an index of a las file you can reload the point cloud by using the Data icon and selecting Add Point Cloud Date.

AddPointCloud

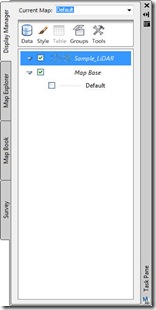
Once the point cloud is loaded into the map it is listed as a map layer in the Display Manager.

Display

Once you have a point cloud loaded you can highlight it and the context sensitive tab on the ribbon will display for the point cloud.

RibbonTab_PointCloud 

The ribbon tab allows you control how the point cloud is display along with a few other tools to work with the point cloud. The Point Display control will allow you to control the number of points (density) displayed. Move the slider to increase/decease the amount of points. The Filter Point Cloud control allows you to filter the point cloud based on the data assigned to the points or by spatial (location on your map). Note: Not all LiDAR files will have data assigned to it. The Style panel of the tab will allow you to set the style of the point cloud based on the classification, elevation, Intensity or RGB assigned to the points. The create panel will allow you to create a surface from the point cloud. You have two formats for the surface file, GeoTiff or ESRI ASC. The Export panel will allow you to export the point cloud to SDF format to be used later in the map or as an ASCII (text) format or even to a LAS format. Exporting it to ASCII will only export the XYZ of the points it will not export any other data and exporting to SDF will create a LARGE SDF file, so beware.

Along with the advantage pack there is some sample files (las) and tutorials on the subscription site that you can also download that provides some assistance on using the new feature.

The AutoCAD Subscription Advantage Pack

There is also an Subscription Advantage Pack for standard AutoCAD as well that can also be ran with Map3D. This advantage pack contains some useful tools for standard AutoCAD objects that for once the Map3D product team has not forgotten about the AutoCAD Map3D users that still use Map3D as AutoCAD or that we still use drawing objects in our maps.

Once installed it adds a new ribbon tab to the ribbon labeled Subscription.

AutoCAD_SubRibbon

The first panel of the tab allows you to isolate objects and unisolate them. The next panel will allow you to select an object then create another object of the same type. The Select panel has the much needed and wished for Select Similar command. It does have a settings options allow you to filter the selection.

SelectSimilar

The last panel contains the Draw Order tools for setting the draw order for annotations and hatches. Keep in mind these are the standard AutoCAD objects, they do not work with Map3D annotations or the feature labels and hatches. Oh yes, if you are an old school user and have not embraced the ribbon interface yet, there is a toolbar for these as well, the AutoCAD SAP for the AutoCAD Map3D SAP you need to create your own toolbar or use the ribbon. 

The Sample Folder or A Few LISP Files to Use

When was the last time you looked at the files in the Sample folder that gets created in the Program Files/ AutoCAD Map3D 20xx ? If you have not looked in years then let me point out a few lisp files (.lsp) that are there and may be of some use to you. Some of them are just samples and meant to be samples of what you can do with lisp programing and Map3D, however there are a few that you may want to use once in a while.

The first one I like is the makegrid.lsp.  What this does is create a grid from rectangular polylines with numbers/text inside each rectangle. It allows you to select the base point for the grid, the number of rows and columns and the size of each. With the number inside the rectangles it allows you to add a prefix and the number of digits for the number. So what do I use it for? A number of different uses but one is for creating a grid for a mapbook. Other times I may use it to create a grid if I’m creating a new line type or AutoCAD shape. Having a grid of 1×1 makes it easy to know when and where my pen up or pen down will be writing out the file.

The next one I like and use every once in a while is the copy_OD.lsp. This allows you to copy object data from one object to another. If you ever exploded a multi-segment pline to individual lines you found out the OD attached doesn’t get copied. This sample allows you to copy that OD to each line segment afterwards.

The listpt.lsp writes out the vertices of a polyline to the command line. If you use it notice it has the points inside parenthesizes  ( ), this is an “Autolisp list” but you can still it if you need to check the vertices of a polyline.

Need to see what direction an object  is going or where the start point is? Then the dirarrow.lsp is what you need to use. This sample will show a directional arrow pointing in the direction the object (Lines, Plines, Arcs) is headed. The sample uses the grdraw function which draws the directional arrow on the screen and not in the dwg file, A regen or redraw action removes the arrows from the screen.

If you are not familiar with using a lisp file with these you can drop and drag them from windows explorer into the AutoCAD editor window and the command to use them is printed to the command line. Done of them have a fancy dialog box or any help files on using them remember they are just samples but you might find some use for them. Or if you like to get into learning lisp they make  a good starting point. 

Win a seat of DotSoft’s MapTools

Want a free seat of the MapTools from Dotsoft? Five lucky readers to this blog will win one seat of the Maptools add-in for AutoCAD Map3d. To be eligible take the survey about the Map3D weblog.  The survey is not just a chance to win but also your answers will help determine the posting on the blog.  I will draw the winners on the 15th of Aug from everyone that provides a current email address and name.  All information collected will remain confidential and used only to notify the winners. A big thanks to DotSoft for providing the free seats. Click Here to take survey .

Need More Map Tools?

Have you ever wonder even with all the great functions and tools available with AutoCAD Map3D there is still one or two tools that are lacking? Have you noticed that the last few releases the new functions have been geared towards FDO functions and nothing towards the enhancements to Object Data objects or any of the other basic map tools that made AutoCAD Map stand out from simple AutoCAD? Well fear no more. DotSoft LLC is to the rescue, with their new MapTools. 

Now let me say something first before I get to far into the MapTools functions. When I started this weblog a few years back I told myself the blog was for tips, tricks and how-do for AutoCAD Map3D (and a little Civil 3D) and not a site to sell readers/followers anything. However seeing that there are still some users out there, my customers included, that are not ready for the move to FDO right yet I feel blogging about these tools is fair enough, besides it’s my blog I can do what I want. 🙂

If you are not familiar with the Dotsoft  they are the good folks that brought us the fine add-on called ToolPac. If you are or were a ToolPac user then you know the MapTools will be just as valuable once you start using them, there is at least one tool in the set that I’m sure some one will like.

I will point out some of the tools and follow up on later posts of how they work. First there is the Grid Editor for Object Data tables. You can select one or many object that have object data attached and view all the object data values in a grid view to all the object you selected. No more trying to select all and getting the “varies” in the property palette. Not only can you view the data but also edit it there in the grid editor. Second tool for object data is the Property Exchange tool. This tool allows you to populate the object’s property from the object data attached to it. Example you have an elevation field in the object data, the property exchange will take the object data  value and move you objects to those elevations. This works good for layers also. Not only can you populate the object properties from the object data, you can also go the other way and populate the object data from the object properties.

Have you ever needed to work in two different coordinate system at the same time in the same map? Well MapTools has an alternate coordinate system tool that allows you to this. It allows allows you to label points as LL even if you are working in a map that has a state plane coordinate system assigned to it. There is even a nice tracking tool that displays the alternate coordinates as you move you crosshairs.   Then there are the polyline tools, check for closing and reverse the segments are a couple of those commands there but the big one a lot of users have been asking for is the break ploylines and not lose the object data attached to the polylines, well MapTools has this.

So there you go with a few extra tools that are available for AutoCAD Map3D. Now the ones I mention are not all there is but the ones that  I ran testing the MapTools as DotSoft was developing them. So if you are interested give them a look at on their site and let Terry know and/or leave a reply here if you are interested or want some thing else in the bundle.  Stay tuned to the blog and you may get a free seat of the MapTools, details to follow in a few days.


Archives

Readers Locations

Top Rated posts

Chat room