Archive for September, 2007

Contours from Shape Files with Elevations

Do you have a contour line file that is in ESRI shp format and need to create a civil surface from it or need the contour lines to be at their correct elevation? You can import it and create Object Data from the lines’ attributes then perform an alter-properties query to set the lines at their correct elevations.

Start by using the map import command to import the shp file, located on the Map menu Tools > Import. Browse to the shp file and select it. For those not familiar with the shape format there needs to be at least 3 files that make up the ESRI shape format. (shp, shx, & dbf) When using the map import you only will see the file with the shp extension.

clip_image002

After you select the file and click OK the Import dialog box displays allowing you some options to set for the import, like the coordinate system transformation or doing a spatial filter and a few more. The only one we need to set is the “Data”. We will convert the shape file attributes into object data.

clip_image004

In the column on the lower half of the dialog click on <None> under the column labeled Data. Then click on the ellipse icon (the 3 dots). This will display the Attribute Data dialog. In this dialog we select “Create object Data” and use the default Object Data table name which is the name of the shape file. Note: Map 3D 20008 versions prefixed with the word “Default” you can rename it if you desire.

clip_image006

You can click on the “Select Fields..” button and see what attributes will be converted and what Map 3D will name the Object Data (OD) fields. This is a good step to ensure there is a field that contains the elevation and it gets converted to the OD. After you view the fields/attributes select OK and OK in the Attribute Data dialog. Select OK in the Import Dialog and wait for the import to happen, the command line will let you know that X number of objects imported. Do a zoom extends and you should see the contour lines.

With the property palette open select a contour line and check that there is an OD table attached to the line and notice that the elevation is listed under the OD table and that the elevation for the Geometry is at “0”.

clip_image008

To get the OD Elevation value to the Geometry we need to perform an alter-property query on the drawing. Start by saving the drawing and close it, then open a new blank drawing or the project you need the contours in.

We start this by attaching the contour drawing that we just saved and closed, in the Map task pane on the map explorer tab right click the Drawing folder and select “Attach”.

clip_image010

Browse to the drawing and highlight it by selecting the name then click the “Add” button then click OK. The drawing should now be listed under the Drawings folder in the Map Explorer.

Now we need to get started on the query. On the Map Explorer, right quick on “Current Query” under the Query Library and select “Define”.

clip_image012

In the Define Query Dialog we need to click “Location” for the query type then select “All” in the Location Condition dialog then click OK. Next we click on the “Alter Properties” button in the option section of the dialog box.

clip_image014

In the “Set Property Altercations” dialog Click on the radio button next to Elevation in the Select Property section.

clip_image016

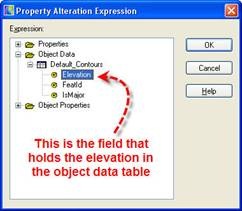
Now click on the Expression button to open up the Property Altercation Expression dialog. Expand the tree to get to the Object data field that contains the elevation. Highlight it by clicking on it and then click OK.

clip_image018

Back in the Set Property Altercations” dialog click on the “Add” button.

clip_image020

At this point we can click OK and return to the Define Query dialog select “Draw” for the query mode and execute the query.

HOWEVER! I want to go one step further with my query and set the major contours on a separate layer named Major and the minor contours on a layer named Minors. I can do this because my OD has one field in my sample named IsMajor. (see above screen shot) The values are 1 & 0, 1 for a major contour, 0 for minor. I am going to alter the layer property for the contours line by setting up a range table and use that for to place the contours on the correct layer. To do this while still in the “Set Property Altercations” I select the radio button next to the ‘Layer” property..

clip_image022

Then click on the “Range” button to start creating a range table.

clip_image024

In the Define Range Table dialog click new and give the range table a name then click OK. The next step is setting the conditions to use for the ranges. This takes knowing what the current OD values are and what you want to return the values as. In my case the values are 1 or 0, and I want them to return either “Major” or “Minor”. For my example it would be like so: In the Condition section, the operator is the equal sign (=) the “Expression Value” I type in 1 then in “Return Value” I type in Major. Then click the Add button.

Cond1

Next I set the condition for the minor the same way, operator is the equal sign, for the “Expression Value” I type in 0, and for the “Return Value” I type in Minor, click the Add button again.

Cond2

clip_image026

Once we set both conditions we can click OK. Now we need to set the rest of the alter property parameters. Back in the “Set Property Altercations” dialog, we click on the expression button and select the IsMajor field from the OD table.

clip_image028

After we OK the Property Altercation Expression and return to the “Set Property Altercations” dialog we select the range table we created from the drop down list and click Add.

clip_image030

We should now have two conditions or statements listed in the dialog.

clip_image032

We can now click OK and return to the Define Query dialog, make sure the query mode is set to Draw, and execute the query.

If everything worked right now we can open up the Layer Property Manager and set the color, line type or lineweight to the “new” layers to display the contour lines.

clip_image034

So with a little practice and trial and error we can take a simple 2d shape file and import then query it to make a good 3D drawing with proper elevations and display capabilities.

Map Book Part 3

Now that you have a template created and our map drawing we can start the map book creation. I already covered what to use for the source, model space or the display manager so I’ll pick up on the template. In the template portion of the dialog browse to the dwt file you want to use and select it. Use the drop down list to select the layout to use. This may be where in your template you created layouts of different sizes or pointing to different plotting devices. Either way make sure you select the layout. The next step is selecting the title block “block” to use, again use the drop down list to select the block. Continue with the adjacent arrow block, making sure you select the radio buttons to use them. The Titleblock and arrows are options and you do not need to select them if you have them in your source map already. (either model space or display manager). Also if the blocks are not in the template you have the option to browse to drawings to use for those blocks by clicking on the ellipse icon (icon with 3 dots). However the layout MUST be in the template.

settings.jpg

The last thing to set is the scale factor for the layout’s viewport. In the screen capture I marked it as to an approximate scale. Reason for that is because in the next step(s) determines as to what the finish scale will be. You should have an idea of what scale you want your pages to be at.

The tiling scheme section comes next, this is where you tell MAP 3D what area you want to be include in the map book. The first choice is by area. Using this option allows you to window the area you want and Map 3D will determine how many columns & rows it needs based on the template layout viewport size and the scale factor you selected in the template settings. Map will generate a grid on the layer selected allowing you to see how many row/columns it will create or how many pages the map book will have. There is also an option to set an overlap value for the tiles. What the overlap does is overlaps the titles so the finish map page displays items around the edge in the adjoining tiles. Setting this to anything greater than 0 will result in the final viewport scale being off by the amount you set it for. So if you want a scale of 100 and an overlap of 5% then you need to add the 5% to the scale factor in the template settings portion of the settings.

byarea.jpg

Another choice to use is by number, this option allows you to specify how many rows & columns to use for the map book. You select the upper left corner by picking a point then set the number of columns and rows to create. You also have the overlap option using this method.

byarea.jpg

The final choice is using a custom area. With this option you need to have polylines created in the source prior. The makegrid.lsp in the sample folder can be used for this if you like. Again be aware of the scale factor and the size of the grid created. If the grid size is not in portion to the viewport size you may end up with a map book that is useless.

Either method you chose allows you to view the tiles before you generate the map book and allows you to go back and make the changes as needed.

The next section allows you to name the pages or layouts a number of different ways. The column and row option allows you to create the names such as A1, A2, B1, B2 etc.

The grid sequential allows names such as 10, 11, 12, 20, 21, 22 etc. The sequential method creates names such as 1, 2, 3, 4 etc. There are a few options on setting the starting number and incrementing that number for all three of these methods. If you work with Township and Ranges then you can name your tiles the same way. The last method of naming the tiles is the data driven names, the names can come from the grid polylines created prior either as attached object data, linked database or any of the other methods you use to attach data to the polylines.

The next section is setting the key map viewport. If you are not using a viewport for a key map you can skip over this section. Here you select what you want in the key map. It can be a linked drawing that has a defined Map Key Source an x-ref drawing or layers in the current map. To me using the layers in the current map is the easiest, unless you are working with the older versions of map books and have the key sources already. To set a layer to use select it in the bottom list and click on the Add Layer to Map Key button. Just keep it simple if you are using a key map, too many layers can be confusing in the end.

The next part allows you to select a legend to use on the pages of the map book. Again if you do not have a legend viewport in your template you can skip this and go with none. The choices are the legend created by the map display manager or a users defined. If you used the display manger to create a legend select that as the option. The user defined is when you created your own legend using the standard objects in AutoCAD such as lines, hatches and text.

The last part to creating the map book is creating the sheet sets. Here the only option you have is to create a new sheet set or a new sub set. If you are just getting started go with the new sheet set option. The sub set option is used in cases where you may already have a sheet set of a large area but in tile number 5 there is a lot of features and you need to create a map book at a different scale to show more details. Here you would create another map book with different settings (scale, tile naming, etc) and append a sub set to the original sheet set under the tile numbered 5. This way you still have one map book but additional pages of tile 5 with details maps of that area.

Now that you have all the settings set click on the Generate button. MAP 3D will create a sheet set, displayed in the map task pane, and layouts for each tile. You can select a page (tile) in the map task pane and right click to zoom to that tile or open that layout and a few other options. If you right click on the map book name at the top of list you can publish to dwf or plotter, rebuilt the set, edit the settings then rebuilt the map book or even check the properties of the map book. 

So now you should know how to create a map book using MAP 3D 2007/2008. Go and try it out, if it does not end up the way you want go back and change a few settings and try again. If you still can not get the hang of it do not save the base drawing and close out and start over.


Archives

Readers Locations

Top Rated posts

Chat room