Plain Text from Object Data

Have you ever imported ESRI SHP files or other GIS files and need to create some simple text labels for that data? Do you have some object data attached to entities that you now need to display that data in the drawing? One method of displaying or labeling those entities is by using Map Annotation Blocks or use FDO. But what if you need something quick and as plain text?

I see questions on how to do this or can Map3D do this. Yes it can be done. You can use the Map3D display manager to query the current drawing then create a “Map3D” text style in the display manager.  

So lets look at the drawing I have for the example.

OD_Info

It’s a simple parcel map imported from an SHP file and object data was created on the import. What I need is to label each parcel  from that object data with the Watershed1 value.

The first step is opening the Map3D Task Pane and using the Display Manager tab. If the task pane is not open use the command MAPWSPACE and select ON at the command line.

Add_Layer

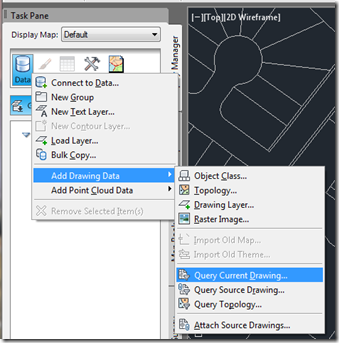
Now click on the Data icon in the display manager, scroll down to “Add Drawing Data”  then select “Query Current Drawing”

The Define Query dialog will open allowing you to define the query. I want to query on my object data so I select “Data” for the query type. The Data Condition dialog will open allowing me to select the data to query on. I select “Object Data” make sure I have the correct Table listed (Parcels), select the field I want the label to display (Watershed1) then for the Operator and Value I use = (equal sign) and * (the wildcard expression).

query

As soon as I click OK it populates the upper part of the Define Query dialog. Clicking OK in this dialog takes me back to my drawing.

I now have a new object or a Map3D Display Manager Layer listed in the Task Pane.

new_Layer

The next step is to add  a text style to display the text that is being queried in on that new layer. TIP: When we say Layer in Map3D Display Manager it is NOT an AutoCAD layer and has no relationship to the layer manager or any of the AutoCAD layers.

To create our text style for our data labels we right click on the layer name in the Display Manager and select “Add Style” then “Text”.

Add_TextStyle

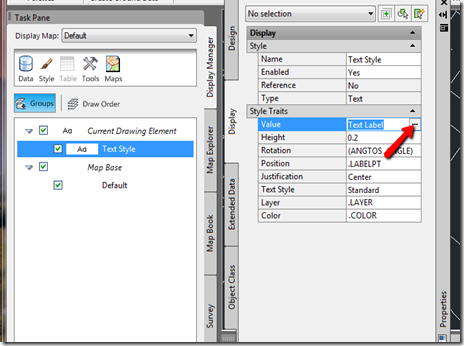
We now have another object in the Display Manager under the “Current Drawing Element” layer named “Text Style”.  Highlight the “Text Style” in the Display Manager and look at the properties of it in the property palette. (Right Click and select Properties to open the property palette.)  This is where we tell it to display the values from the Object Data table.

Select the Value- Text Label to show the ellipsis icon (the 3 dots) Click on the icon to open the Expression Chooser. 

TextStyle_default

In the Expression Chooser, expand the tree to get to the Object Data field to label from. Select the field and click OK.

expression 

Back it the Property Palette set the Height as needed and any other property you wish. Notice I changed the Height to 10 and provided a better fitting name for the text style.

Text_Final

Notice as you start to make changes in the property palette for the Text Style the labels change instantly allowing you to see the changes as you make them.

Labed_Drawing

Now back in the drawing we have labels for all of the parcels and they are plain AutoCAD text objects. No FDO text style, no Civil3D label and no Map Annotation blocks.

2012 in review

The WordPress.com stats helper monkeys prepared a 2012 annual report for this blog.

Here’s an excerpt:

4,329 films were submitted to the 2012 Cannes Film Festival. This blog had 35,000 views in 2012. If each view were a film, this blog would power 8 Film Festivals

Click here to see the complete report.

The Time Has Come

Temp_Close

To all my followers and readers the time has come to closed the web log. For how long is unknown and I have no idea if I will post again to it. It’s been a while since I had employment working with AutoCAD MAP3D or Civil3D so I’ll hang up the closed sign for now. When and if it the “Open” sign gets hung back up is anyone’s guess. I’m currently working as a labor supporting the most powerful and only Air Assault Division in the world. If anyone is in the area of Ft. Campbell, KY stop by the Gear to Go shop and say hello, just ask for Murph.

It’s been a good run and I hope I was able to help some Map3D users over the year and pointed everyone in the right direction. The intend of the blog was to provide users help on the software and show case a few things that MAP 3D is able to do that “the other guys” have been doing for years.

Thanks for reading and following me over the years and Godspeed.


The Original Murph.

Marketing with Map3D plus

As most of my readers know I was working with an Autodesk reseller as their Geospatial technician. One of the duties was visiting a customer at their office either to offer support, demo some new feature or provide some other service. Now with me being based out of my home at the farthest  northern area of the reseller’s area  I might need to drive 8 hours or more to get to some of those customers. I didn’t make much senses (or dollars) to drive that distance for a 2 hour meeting then drive back. So most of the time I would get my sale reps in those areas to set up visits with other customers in the area to make the best use of my time. Not the trouble was finding the customers in the area that may be Geospatial or Map users. Unlike some of the other AutoCAD vertical applications Map3D users are not major customers or may only have 1-3 licenses of AutoCAD MAP3D. They tend to slip though the cracks a lot of time if they don’t call the reseller every so often. Now I need to say kudos to the sale reps that I worked with, they did the best they could to find those customers.

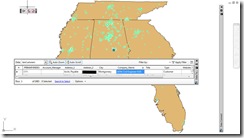
So how can we make it better or easier to locate those customer? Simple use the product we sold and demo. Anyone that is in the sales business rather its software or widgets and doodads to services and consulting has a record of their customers and what products those customers buy and use. Either in some database/spreadsheet or even on some paper bound books in the back room. The first step and the hardest is plotting those customers on a map. With some geocoding features I had I was able to to create the customers locations as points on an AutoCAD MAP3D dwg. So now I could open up that map select the customer I was going to visit in the table view then create a buffer to select other customers in the area.

mapSelect

The trouble was knowing if that customer was a Geospatial customer or not. Solving that means having the database contain the products the customer used include then querying on that as well. The next big huddle was I can do it in AutoCAD MAP3D with no problem but the folks that schedule the visits may not be able to. Either they don’t have MAP3D and the data on their laptops or they don’t have the knowledge to do the query. So the next step is to the web. With a Open Source Map Guide installment and access to the it for the sales folks it was just a simple publish my map and data to that Map Guide server. With a few sample code or examples it was easy to create a couple search buttons to locate the first customer then create the buffer & query then return a list of the other customers in the area. Now the only trouble was the Map Guide server was an old PC I had in my home. That meant to really use it required me to open up my firewall to the general public and my ISP to keep the line up at all time.  As it was, the time to load a MG page was way to long and not feasible let alone the time to query the map for the data. In a nutshell that would of been great if the server was a real web server and on the employers network. Sorry I don’t have any screen capture of the Map Guide server running this, the PC that hosted it started smoking one day and smelled a little funny so it sits out in the garage right now. 

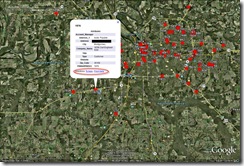
The next idea was Google Earth and Google Maps. Using the free Google Earth provider from SL-KING I was able to create  a kmz file that could be  opened in Google Earth. Now all I needed to do was provide that kmz to the sales team and instruction on using it.

GE

An extra benefit to the Google earth was it could provide driving instructions to the customers sites as well.

So you may now be saying “That’s great Murph, you can now visit more than one customer on your trips but the title of the post is MARKETING with Map3D”.

Right so where does the marketing come into this? Well step one was getting the customers on the map. Step two is having as much data on those customers as you can get. Having the product they use, having the type of work they do, the number of users and so on in the data. Once that data is there it can be used to “SEE” where the marketing needs to go, where the best location to rope in new customer is at. It’s easier to sell a boat to someone that lives next to water that it is to a nomad. Adding more data and layers  can make the queries even better. Having data on event centers or hotels or places to hold those conferences may give marketing a better chance to select the where at next time or to keep the cost down and the ROI up.

Now my disclaimer on this is I never had the chance to implement this as well as it should be for a number of reasons and I’m only posting this after seeing an job opening for a Marking Analysis  this morning and it brought back memories of doing it. So any marketing folks reading this you can add another tool to your toolbox.

Add Custom Toolbars or Commands

Ever need to create your own toolbar or command in AutoCAD? Maybe you have some custom lisp routines you been using for years and need to add them to your current version of AutoCAD MAP3D. Even if I’m pro-ribbon there may be a time when a toolbar may be easier to get to those custom routines.

To do so we need  to check a few things and think out what we want. Most all commands now will allow to to link a icon to them. So first we need the icons and a folder to store them. For this the icons need to be bmp format and 64×64 pixies work fine for me. Next is the folder these need to be in. Look at the Options and see where it looks for them.

IconFolder

Next is the folder that your lisp files or scripts are located in. Again these need to be in the support path and I like to them all in their own folder on my local drive. (network location if you want to share them same for the icons.) Keeping them separate from the program files/ AutoCAD directory makes it easy to upgrade or do a repair, you don’t have to worry about them getting deleted on a uninstall.

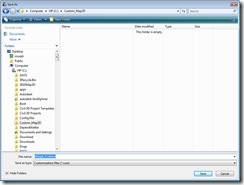
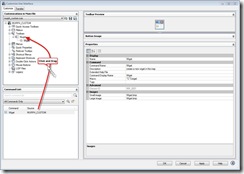
Now after you create your icons, paint works fine for me, and the folders set up we start in the Customize Users Interface or CUI. The CUI command will open it for you. The first step I do is create a new CUIX file, again this is one of the safe ways to keep your custom toolbars/ribbons etc. from being deleted and allow sharing. In the CUI (expand it) click on the transfer tab at the top. Then on the right side select click on the icon to create a new Customization file. (looks like a new folder icon) Provide a name for the CUIX and set the location in the folder you have listed in your Options Support files.

CUI_Location

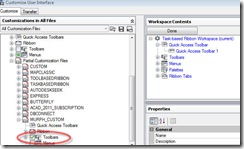
Once you create the file go back to the left and click on the Customize tab at the top. All you did was create an empty CUIX file so now we need to load it and add our toolbars or ribbon tabs/panels. To load it scroll down to the Partial Customize Files in the tree to the left side and right click > Load Partial Customized File. Browse to the file you created and load it. 

load_Partical

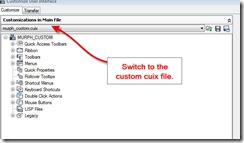
Once you load it that partial CUIX should be the one listed in the drop down list at the top.  If not switch to it. This is where we want to create you custom toolbar.

partical

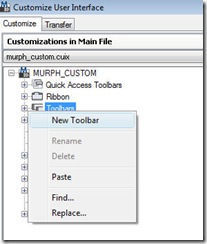
Expand the tree for the toolbar section, right click on the Toolbar and select New Toolbar.

newToolbar

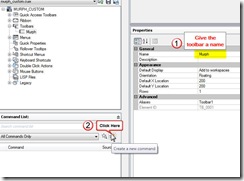
The right side of the CUI changes it’s display and allows you to name the tool. The default name is Toolbar1, just rename it by typing over the name. The rest of the parameters for it can stay with the defaults.

Now we just need to create the commands to add to our toolbar. To do so at the bottom section of the CUI is where the commands are for the custom CUIX file. By default it has none in the list. So click on the icon to create a new command. (the icon with a STAR and orange color sun on it)

command1

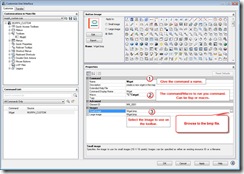
As the right side changes display we start to fill in our parameters for that command. Provide a name for the command, set the Macro to run the custom command, this can be the command to run a lisp routine or create your own macro if you know how to use macros. Next select the image(s) to use for that command.

commandSetup

Now we have a complete command in the command list. The next step it to add that command to the toolbar. Select the command and drag it to the toolbar above.

Add2TB

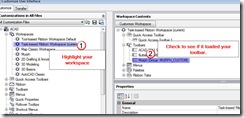
Now create the rest of your commands and drag those up to your toolbar as well. When you have all of your custom commands create switch to the All Customized Files at the top in the drop down list. Highlight your current workspace in the tree on the left, then on the right side expand the tree for the toolbar and you should see your new toolbar.

check

If not you can load that toolbar into the workspace by Clicking on Customize Workspace button on the right, then expand the partial customize files on the left, expand your custom CUIX and place a check mark in the box for the tool.

 addtoolbar

When you are done click the Done button on the right side.

Click the Apply button at the bottom to close the CUI and you should have your new toolbar in AutoCAD MAP3D. These same steps will allow you to create a new ribbon tab and panel with your custom commands as well. Just remember a command goes in a Panel, a Panel goes goes in a TAB of the ribbon. Create the Tab then the Panel, place the commands on the Panel then drag the Panel to the Tab. 

Shopping with Map3D

By now most everyone has heard about AutoCAD for Mac. The AutoCAD built to run on the Apple computer. There’s promise of apps that will run on the I-Pad and I-Pod Touch coming out soon. So how about taking it a step farther. OK we all want to Run AutoCAD MAP3D on a I-Pad or something we can take out to the field and do field checks, updates and/or edit our maps. BUT in my wisdom of thinking of where my next pay check may come from and looking at being a door greeter at the one of the super centers here in town why not tie my passion for MAP3D into that as well.

Now hear me out a bit before you all think the Murph has gone off his rocker. How many times have you walked into one of those super giant stores only to get lost looking for that one item and end up buying nothing? Yes you did, admitted it you got all frustrated and walked away.

So here’s the plan. How about on each of those shopping carts is a trimmed down I-Pad or a I-Pod Touch with a SD card reader, USB port or whatever Apple uses that allows you to upload your shopping list and the app creates a map of the store with the locations of those items on the screen. OK real men don’t use shopping list other than at the lumber stores or car parts places. That is where the app allows the real men to type or pick from a pull down list the item(s) they need to buy and maps it on the screen for them. Now most of us have seen those terminals in stores that people enter their list in for bridal registry or birthdays and such that allows shoppers to see the items, price and location that your friend register for. This would be an extension to that. Only on the shopping cart and created once when you start shopping.

So how about it? I bet we could even get the gear head mechanical guys or Inventor folks to create some robotics to drive the shopping cart for us.  

GIS and Crime Fighting

In Oct 2000 CBS launched a new TV show named “The District”. For those that don’t remember it, it starred Craig T. Nelson as Chief Jack Mannion, chief of the Washington D.C. police department. During each episode there was a few minutes that the chief used the department’s GIS system to help solve the crime of the week. Now being the GIS geek that I was back then (side note: I was using ESRI 3.X and AutoCAD back then) and my first career was law enforcement with the Army, I was hooked on watching it each week. The GIS system that was used on the show was ESRI based. If you watch close enough and knew the software you could see the little clues.

In the early years of GIS not many cities or other government police department were aware of GIS or how to use it to fight crime. Now just about every major city or county police force use it to some extends. Just do a search on sex offenders in your area and you will get a web based map with convicted sex offenders located on it. GIS is also being used to track other crimes and activities with that info (in limited form) available to the public by web mapping today. But did you know that back in 1998 the City of Oakland CA. launched a web site named Crime Watch. This was 2 years early than CBS aired “The District”. A web based map showing the residents of  Oakland where crimes were reported in the city.

Crime Watch was one of the first web based mapping systems that the general public could use. Built on Autodesk Map Guide 4.0 it allowed a visitor to the site to enter an address and then it return a map of that area with the reported crimes, as symbols related to the crime, on the map. Web base mapping has improved since the Crime Watch days along with Map Guide. With open source applications and Google Maps almost anyone can set up their own Crime Watch.

Now don’t think that because you may not have a Map Guide Enterprise site to map out the crime in your city or any other GIS Enterprise for that matter you can not use GIS to fight crime. With AutoCAD MAP 3D you can still fight crime and track it on your desktops. By using SDF data you can create the data to analysis with buffers and overlays. Using a polygon feature to show known gang territories and with points features for major crimes you can do basic analysis to help  solve those crimes or curtail the gang activities. Adding traffic accidents into the maps you can pin point areas that may need extra patrols. Of course most major police departments know this already but the great thing about using the GIS capabilities in AutoCAD MAP 3D is you can display that data, plot it out and use those printed maps to show city administers and budget controllers why you need the funding for those projects. Even in courts, evidences can be presented to the jurors and the court to get rulings that may have been impossible before.

So if you are with a small government agency with a limited police force inform them that AutoCAD MAP 3D can help take a bite out of crime.

A History Class

How about a little history lesson? Most Map3D users today forgot or don’t know how AutoCAD Map3D came about. So for today’s lesson we go back in time and look at a few key points in the life of AutoCAD Map3D. Of course my disclaimer is all this is from my memory and some creative use of the wayback machine to locate some info and is not the official history or endorsed by Autodesk.
Let’s start at the beginning August 9, 1996 with a quote from Autodesk themselves. “ Autodesk today took its first step into the fast-growing geographic information systems (GIS) market, as the company began shipping its first dedicated mapping and GIS product, AutoCAD® Map.”
The price for the software then was listed as $4,495.00 US  or an upgrade price of $365 to $995 depending on the users current version. The upgrades where from AutoCAD or AutoCAD Data Extension® (ADE). Now we all know what AutoCAD is but what’s this AutoCAD Data Extension program? Well in layman’s terms it was a OEM for AutoCAD, the simple API or code that you had to build the interface for. If you look at some of the commands that have around from day one still in the 2011 version today you can see the prefix ADE.
Another quote from the past “AutoCAD Map software focuses on five key areas: digital map creation; analysis; maintenance of accurate, up-to-date maps; data exchange; and publishing.” That statement is still true today.  If fact that statement and those five key areas is how MAP got the name MAP, it could have been named GIS Desktop or something else for all we know. After all this was the same time frame that Mechanical Desktop, Land Desktop and Architectural Desktop were being released. So why the name MAP? Simple someone there at Autodesk took a good look at what MAP did and put the pieces together in a nice acronym MAP. Manage, Analyze, and Presentation. Manage is the using of multiple drawings and updating all of them at one time and having multiple users working in the same drawings at once.  Analyze by creating the topologies and query objects based on extended data.. Presentation is the theme creation for those drawings and analysis preformed. 
The MAP acronym is still true today, 14 years later. We manage our drawings and data, we analysis that data and/or drawings and then we present those findings from the analysis. 
Lets jump ahead 6 months to May 28, 1997 to the next version of MAP (MAP2) unlike the first version of MAP which ran on the R13 AutoCAD, ran on AutoCAD R14. A much improved platform and the first taste of layouts. Here’s a quote from that press release “"Performance alone is a compelling argument to move to AutoCAD Map Release 2.0," says Steve Carter, Automated Mapping Project Systems Coordinator at PacifiCorp, the third largest electric utility west of the Mississippi. Carter currently uses AutoCAD Map 1.0, and beta tested Release 2.0. "Reduced start-up time, faster queries, and better draw and edit performance are noticeable in this new release."
Not only was the performance improvements  a big reason to move up to MAP2 but the listed price for it dropped to $4295.00. How often do you see that? A new and improved version for a lower cost?
MAP 2 also was able to import ERSI ARC Info/Coverage files and use solid fill for thematic mapping and supported raster files.
The next version, MAP 3, did not get released until  June 18, 1998. I was not able to find much information on this version. During this time period Autodesk was focusing on World Map, MapGuide and GIS Design  Server.
The next version MAP 4 or MAP 2000/2000i came out built on the AutoCAD 2000/2000i version. The I was for internet and again most of the new features were the standard AutoCAD features and/or some changes to the interface, layouts and plotting. It was released in the early year of 2000 then again later in the year as 2000i. As I remember it this was the same time frame that Autodesk was offering the VIP subscription as a way to budget the your software and get current releases. Again I was unable to find any information or press releases from that time but do recall signing up for the VIP program and getting MAP 2000 and then MAP 2000i in a short period of time. That short turn around, that I recall may have been the results that I was able to budget for AutoCAD MAP and get the company to upgrade at that time of the release cycle and going from AutoCAD to AutoCAD MAP.
MAP 5 (2002) was released around June/July of 2001. Build on AutoCAD 2002 it now offered support for MrSid and ECW files along with a connection to Oracle 8i Spatial database. 
I found some documentation on a MAP 6 also build on AutoCAD 2002 that was to be released later at the end of the year 2002. The key features of this release was “Classification”, “COGO” tools, “Annotation” and the new “Multiloop” Polygon. Now I am thinking that Map 6 was to become MAP 2004. About the time of this release is when Autodesk decided that the naming convection was misleading and decided to rebrand the verticals with the same version as standard AutoCAD. So I’ll say that MAP 6 was re-released a few months later in 2003 as MAP 2004 build on the new AutoCAD 2004 platform. In my research I found some archived web pages that contradict each other or where not complete so if I’m wrong on that I’ll let someone correct me.
The next version released in 2004 also had a slight name changed, it was now MAP 3D 2005. The addition of 3D was added to the name. This version had a little mix of Civil 3D in it. It allowed point groups, surface creations, analysis and visualization. It also had LandXML support.
The 2006 version MAP 3D 2006 gave us the first look of workspaces, a way to create a users’ interface the way we wanted. It also gave us a new Map Book tool. With a few standard AutoCAD feature like dynamic blocks there where some performance changes as well.
Then came AutoCAD MAP 3D 2007, a new way to work with GIS data, the FDO or data connect. Using some of the functions out of Map Guide we now have a method to connect with more data without having to use the old map import/export commands. Even though we could connect to Oracle, MySQL and ESRI SDE data in older versions the 2007 version made it a lot easier.  I like to say that the 2007 version takes us up to the current “modern” method of creating maps and data. The next few versions released added new features to work with the data connect/FDO data and brings up to the current version we are using today. 
So there you go a semi short AutoCAD MAP history lesson. If anyone finds any errors then free feel to point them out as I said this is an unofficial history and working with a 50+ year old mind it may be jumbled up at times.

Using AutoCAD MAP3D Document View

As promised here is a sample of using the Document View functions in Map3D. To set the stage for this we set the scenario as so. We GPSed the utility power line with a handheld GPS unit. As we GPS the pole we also took a picture of the pole, we tag or named the image file the same as the pole number. When we got back into the office we downloaded the images into their own folder on the server alone with the GPS points and data we collected in the field. We then imported the points and created the object data tables from the point data. So now we want to link those images to our points or poles block in the map so as we click on a pole we can view the photo we took in the field.

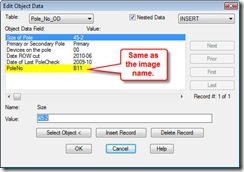
This is a good example of using the document view tool. The first step is making sure the OD table has the correct information and fields in it and that the images are in a folder that we can get to.

OD_Table

Image_Folder

Looking at my example we see the OD table has a field value that matches the image file names.

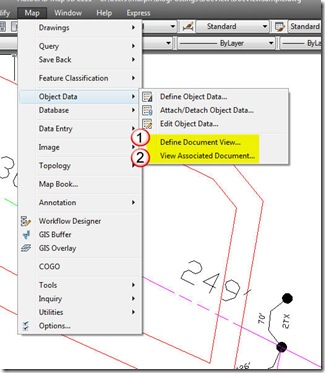
Once those two steps are complete we have to define the Document View. In order to do this we need to be in the Classic Map workspace. Looks like whoever created the default Ribbons for Map3D forgot these commands or thought we didn’t need them. Using the Map menu pulldown select the Define Document View from the Object Data section.

menu

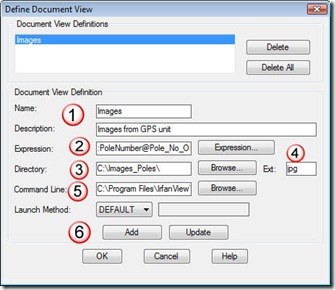
In the Define Document View Dialog (Yes the old style dialog that you can not resize) We set up the parameters Map3D uses to open/display the images.

Define

1. Give the definition a name and description.

2. For the expression in my example I use the PoleNumber field from my Pole_No_OD Object Data Table. You can use the Expression button to browse and select your expression. (Do not confuse that with the FDO expression builder)

3. Select the folder where your documents are stored, you can use the browse button to get to it.

4. Type in the file extension for the type of document you want to view. In my example its jpg but you can also use word documents or (almost) any type of document to view.

5. Next you need to provide the command line for the application used to open and view the documents. Again use the browse button and browse to the exe file that will open the document. With my example and images as my documents I selected my installed IrfanView application, I could used Paintbrush as well but I like the speed of IrfanView.

6. Click the ADD button to add it to the list at the top.

Now the Update button is nice if you need to go back and change one of the parameter. Nice to have for the first few tries, you do not have to start over if something does work the first time, edit and update.

Now that you have the document view defined, to use it select the View Associated Document from the Map menu Object Data section and select the object with the OD table attached. If everything works you should have that document open up in it’s own application.


The sample in action.

Greek or Nerd (Using links in OD Tables)

To start I’ll say I’m one of those geo-cache hunters that spends my free time looking for Tupperware hidden out in the woods using million dollar satellites. If you don’t know what a geocaching is here is a link. So thinking I would tie it into AutoCAD MAP3D and have a little advance over the next guy, I like viewing those little hidden treasure location in a map and see them all at once and in relation to each other.  As doing so I figured I would share a little solution that many Map3D users have asked over the years. That is how can I open a hyperlink from my data.

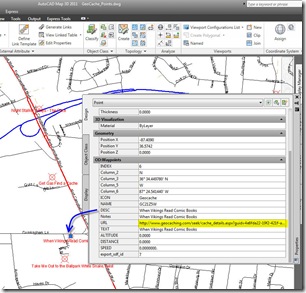
To start here’s a look at my map and the object data I have attached to my geocache points.

OD_Data

The points are the standard AutoCAD points with object data attached. The data contains a field with a value to a web site page. So how can I open the web page up to view it with out the old copy from the OD table and open my web browser and paste the value into it. Simple. Just use a little lisp routine that I’ll show you how you can customize to fit your Object Data table and fields names.

Here’s my version of the lisp file;

(defun c:FL (/)
  (setq ent (car (entsel “\nSelect point to follow link”)))
  (setq link (ade_odgetfield ent “waypoints” “url” 0))
  (command “Browser” link)
)

All you need to do  change the table name and field name to meet your meets. In my sample my table name is WAYPOINTS and field name is URL. Just write your lisp file with those changes after the (ade_odgetfield ent in line 3 of my example. Save the lisp file, load it in your drawing, then use the command FL to Follow your Links.

Now if you need to link to a image file or another file on your network I will post about using the object data document view tools that works for those later.

A quick video of it in action.


Archives

Readers Locations

Top Rated posts

Chat room